Over the years my fibre (FTTC) broadband speed has slowly dropped from about 60Mbps to less than 40Mbps. This is probably due to the crosstalk as more people on my cabinet get fibre activated. I can still get 60Mbps by changing the SNR margin but the DLM system doesn’t like that even though the connection seems stable to me.
To help try and work out a good SNR margin to use, and to track when the DLM system makes changes to my connection, I decided to try and monitor it with a “pretty” graph (OK, maybe it’s not very pretty but its easier to look at than a load of numbers).
To get the stats from the DrayTek router I made a little Python script that will use telnet to get the numbers. Some of the stats can be obtained with SNMP but not all of them. The downside to using telnet is that only one person at a time can be logged in with it, so if you needed to login to run some commands you will need to stop the script first.
#!/usr/bin/python3
from telnetlib import Telnet
import time
import re

username = "admin"
password = "password"
timeout = 2
interval = 15

with Telnet('192.168.1.1', 23) as tn:
    tn.read_until(b"Account:", timeout)
    tn.write(username.encode('ascii') + b"\n")
    tn.read_until(b"Password: ", timeout)
    tn.write(password.encode('ascii') + b"\n")
    tn.read_until(b"DrayTek> ", timeout)
    while True:
        tn.write(b"vdsl status\n")
        status = tn.read_until(b"DrayTek> ", timeout)
        tn.write(b"vdsl status more\n")
        statusmore = tn.read_until(b"DrayTek> ", timeout)

        for line in status.splitlines():
            if(match := re.search('\s+DS Actual Rate\s+:\s+(\d+) bps\s+US Actual Rate\s+:\s+(\d+) bps',
                                  line.decode())):
                act_rate_down = int(match.group(1))
                act_rate_up = int(match.group(2))
            if(match := re.search('\s+DS Attainable Rate\s+:\s+(\d+) bps\s+US Attainable Rate\s+:\s+(\d+) bps',
                                  line.decode())):
                att_rate_down = int(match.group(1))
                att_rate_up = int(match.group(2))
            if(match := re.search('\s+DS Interleave Depth\s+:\s+(\d+)\s+US Interleave Depth\s+:\s+(\d+)\s+',
                                  line.decode())):
                intl_down = int(match.group(1))
                intl_up = int(match.group(2))
            if(match := re.search('\s+NE Current Attenuation\s+:\s+(\d+)\s+dB\s+Cur SNR Margin\s+:\s+(\d+)\s+dB',
                                  line.decode())):
                atten_down = int(match.group(1))
                snr_down = int(match.group(2))
            if(match := re.search('\s+Far Current Attenuation\s+:\s+(\d+)\s+dB\s+Far SNR Margin\s+:\s+(\d+)\s+dB',
                                  line.decode())):
                atten_up = int(match.group(1))
                snr_up = int(match.group(2))

        for line in statusmore.splitlines():
            if(match := re.search('\s+FECS\s+:\s+(\d+)\s+(\d+) \(seconds\)', line.decode())):
                fec_down = int(match.group(1))
                fec_up = int(match.group(2))
            if(match := re.search('\s+ES\s+:\s+(\d+)\s+(\d+) \(seconds\)', line.decode())):
                es_down = int(match.group(1))
                es_up = int(match.group(2))
            if(match := re.search('\s+SES\s+:\s+(\d+)\s+(\d+) \(seconds\)', line.decode())):
                ses_down = int(match.group(1))
                ses_up = int(match.group(2))
            if(match := re.search('\s+CRC\s+:\s+(\d+)\s+(\d+)', line.decode())):
                crc_down = int(match.group(1))
                crc_up = int(match.group(2))

        es_down_total = es_down + ses_down
        es_up_total = es_up + ses_up

        print(f"PUTVAL draytek2/vdsl/bitrate-act_down interval={interval} N:{act_rate_down}")
        print(f"PUTVAL draytek2/vdsl/bitrate-act_up interval={interval} N:{act_rate_up}")
        print(f"PUTVAL draytek2/vdsl/bitrate-att_down interval={interval} N:{att_rate_down}")
        print(f"PUTVAL draytek2/vdsl/bitrate-att_up interval={interval} N:{att_rate_up}")
        print(f"PUTVAL draytek2/vdsl/capacity-intl_down interval={interval} N:{intl_down}")
        print(f"PUTVAL draytek2/vdsl/capacity-intl_up interval={interval} N:{intl_up}")
        print(f"PUTVAL draytek2/vdsl/capacity-atten_down interval={interval} N:{atten_down}")
        print(f"PUTVAL draytek2/vdsl/capacity-snr_down interval={interval} N:{snr_down}")
        print(f"PUTVAL draytek2/vdsl/capacity-atten_up interval={interval} N:{atten_up}")
        print(f"PUTVAL draytek2/vdsl/capacity-snr_up interval={interval} N:{snr_up}")

        print(f"PUTVAL draytek2/vdsl/duration-fec_down interval={interval} N:{fec_down}")
        print(f"PUTVAL draytek2/vdsl/duration-fec_up interval={interval} N:{fec_up}")
        print(f"PUTVAL draytek2/vdsl/duration-es_down interval={interval} N:{es_down}")
        print(f"PUTVAL draytek2/vdsl/duration-es_up interval={interval} N:{es_up}")
        print(f"PUTVAL draytek2/vdsl/duration-ses_down interval={interval} N:{ses_down}")
        print(f"PUTVAL draytek2/vdsl/duration-ses_up interval={interval} N:{ses_up}")
        print(f"PUTVAL draytek2/vdsl/errors-crc_down interval={interval} N:{crc_down}")
        print(f"PUTVAL draytek2/vdsl/errors-crc_up interval={interval} N:{crc_up}")
        print("", end='', flush=True)

        time.sleep(interval)
This script can then be called from collectd. PUTVAL tells collectd to send each value to its output plugins. The flush is needed at the end to make sure Python actually prints the last bit of data in its output buffer instead of waiting and sending it with the next lot of data.
To run this script from collectd you need to add something like the following to /etc/collectd.conf
<Plugin exec>
        Exec "nobody:nogroup" "/usr/local/bin/dtmon.py"
</Plugin>
and make sure that the LoadPlugin exec line is uncommented near the top to enable the exec plugin.
That is the input done, now you need to configure the output. By default collectd is probably already writing the data into rrd databases, but I want it sent to influxdb so I need to enable the network plugin in collectd by uncommenting the line LoadPlugin network and then configuring it with something like
<Plugin network>
        Server "localhost" "25826"
</Plugin>
Obviously if you are going to be running influxdb on a different server or port you need to change them, but this is all the info the network plugin needs.
The last step is to install influxdb and configure it to accept data from collectd. The example configuration should come with a collectd section already so you just need to enable it and make sure you tell it where to find the collectd types.db file. You can find the location of this file by looking for the TypeDB option in the Global section of your collectd.conf. Mine is /usr/share/collectd/types.db and I want to use port 25826 for the incoming connection so my /etc/influxdb/influxdb.conf contains the following:
[[collectd]]
  enabled = true
  bind-address = ":25826"
  database = "collectd"
  retention-policy = ""
  #
  # The collectd service supports either scanning a directory for multiple types
  # db files, or specifying a single db file.
  typesdb = "/usr/share/collectd"

  # Flush if this many points get buffered
  batch-size = 5000

  # Number of batches that may be pending in memory
  batch-pending = 10

  # Flush at least this often even if we haven't hit buffer limit
  batch-timeout = "10s"

  # UDP Read buffer size, 0 means OS default. UDP listener will fail if set above OS max.
  read-buffer = 0
Now you can start up influxdb and collectd and it will hopefully start pulling the values from your router every 15 seconds and storing them in the collectd database of influxdb ready to use in a Grafana dashboard.
Since I was most interested in the number of errored seconds per day I created Grafana queries which grouped the number of errors into daily totals and displayed them as a bar chart. By setting the relative time in the query options to 2w and a query like
SELECT last("value")-first("value") FROM "vdsl_seconds" WHERE ("type_instance" = 'es_down') AND $timeFilter GROUP BY time(1d) fill(null)The chart looks something like this
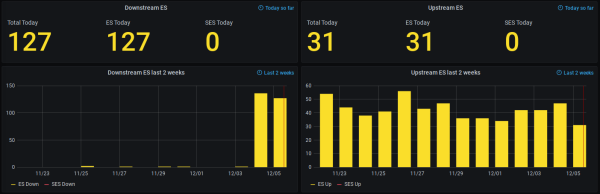
More downstream errors the last 2 days because error correction was disabled
This query doesn’t account for the counters resetting though, so if your router reconnects then the total value for that day will be wrong – and probably negative.
There are lots of other stats recorded by the Python script though so a few more graphs you can play around with such as SNR margin changes and max attainable speeds throughout the day.